Debugging Impression Tracking
This guide walks through debugging and verifying your impression tracking integration as part of the Button Personalization integration.
Debugging
Enable Impression Tracking debug mode
Impression tracking debugging can be enabled by inserting the following line of code in your app in the same location that you call Button.configure.
Button.debug.visualDebuggingEnabled = true
Button.debug().isVisualDebuggingEnabled = true
Button.debug().setVisualDebuggingEnabled(true);
Compiling and running your app with this line of code will enable all Impression Tracking debugging features including console logs and visual debugging cues.
Debug console

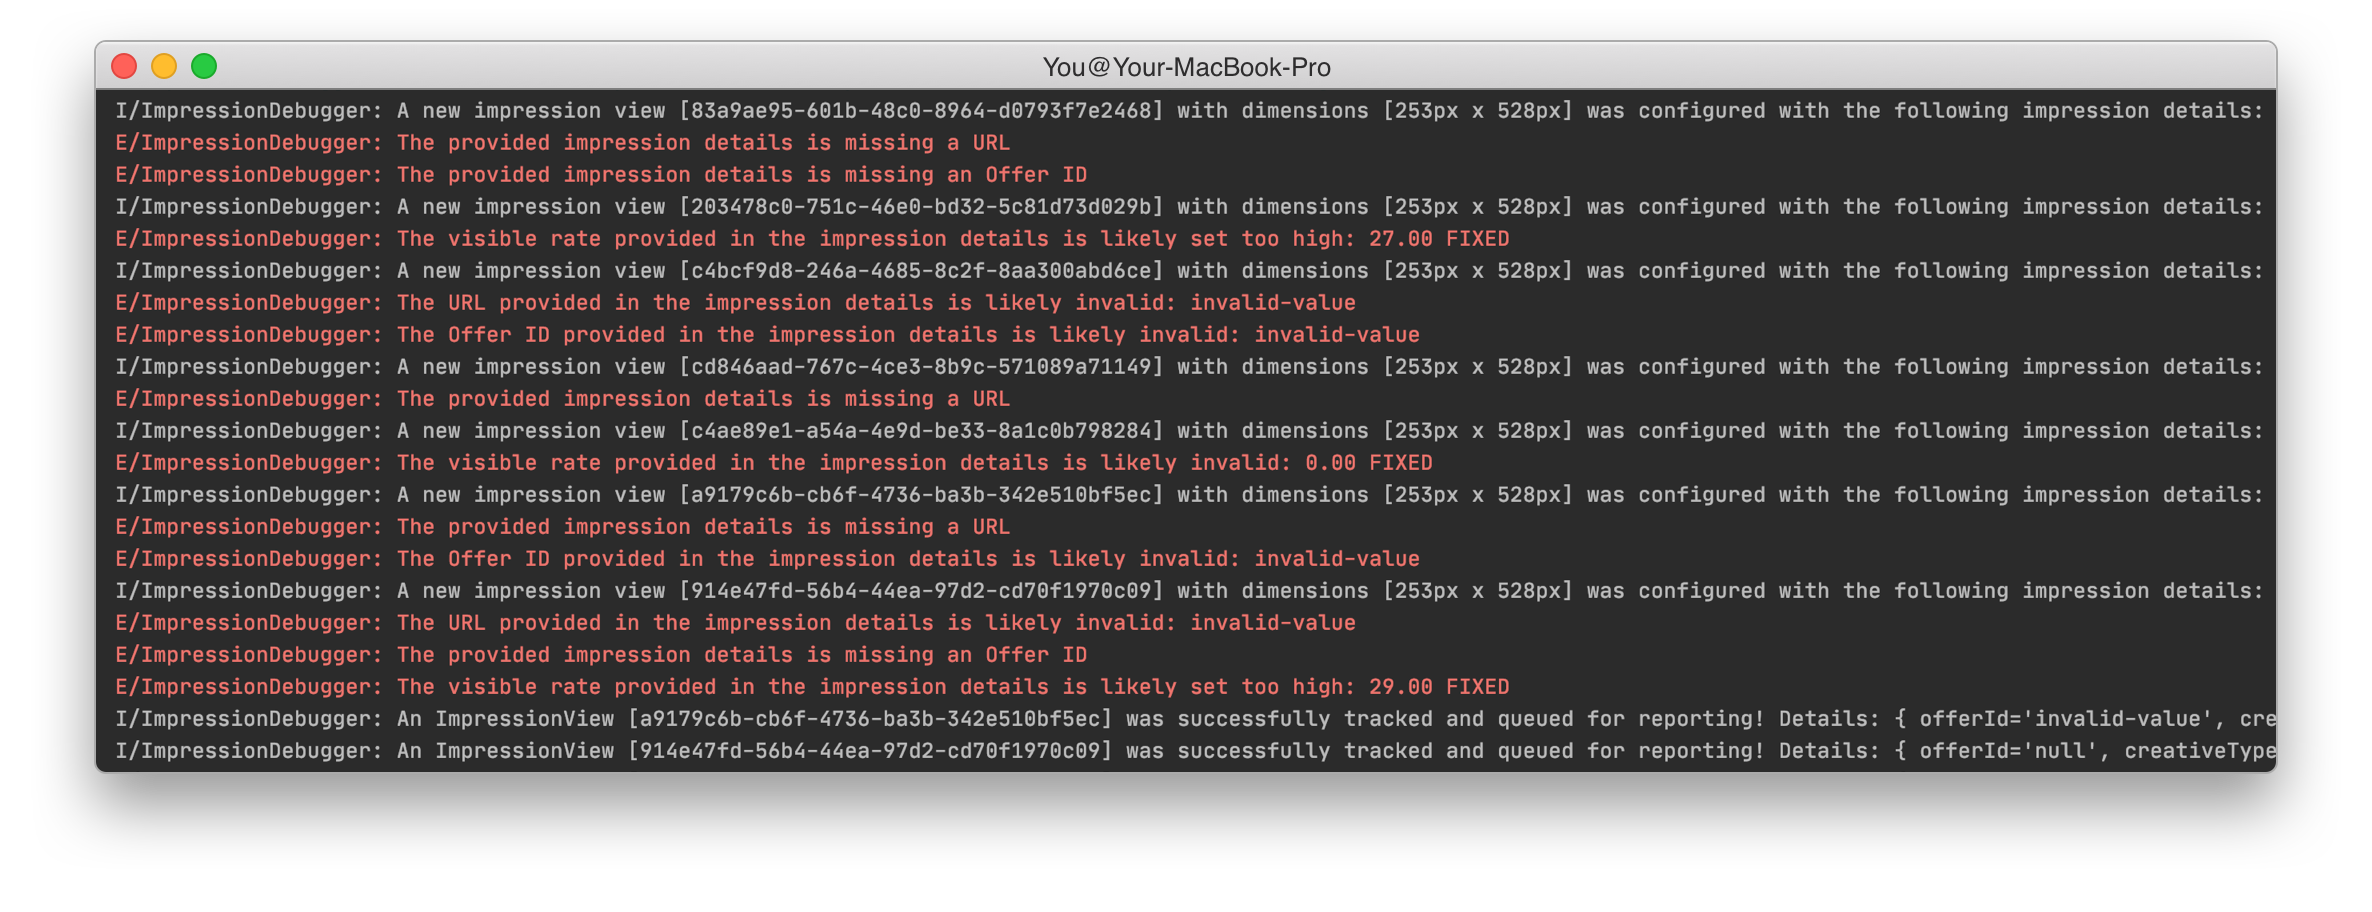
Above is an example of a debug session (in this case Android) that you may see.
The debug console will show you:
- All impression events that are reported with field values
- Warnings for observable issues:
- Invalid offer ID
- Offer values that could indicate a calculation error (e.g. too high or low)
- Missing field values
Visual Impression Tracking Debugging
Visual impression tracking allows you to see the views, their bounds and when they're tracking.
View videoUsing the visual debugging mode, you can confirm:
- The impression tracking view covers your offer view
- Views are being configured correctly
- Cell recycling is working as expected
Impression View Details
You can also tap on the "i" on any impression tracking view to see full details of the configuration for that view.
View videoYou can use this view to confirm:
- The Offer and Impression ID are being correctly configured
- The visible rate & type match the offer shown to the user
- The creative type is set correctly
You can also copy the details incase you need to share it with someone else on your team, or on the Button team!
Updated over 4 years ago